The average manager spends 8 hours a week collecting updates, and 40% of those reports go unread. Most teams either over-report, under-report, or report without purpose.
Knowing how to choose the best reporting frequency for your team means striking the right balance - one that reduces noise, sharpens focus, and moves projects forward.
In this article, we will explore:
- Find your team’s ideal reporting rhythm using five smart factors
- Avoid common reporting mistakes that drain productivity
- Write better reports by matching content to your cadence
Choose the perfect reporting cadence: The 5-factor framework your team needs
Struggling to find the right reporting rhythm? Reporting too often wastes time. Reporting too little leads to confusion. The key is choosing a frequency that aligns with how your team works, what your project demands, and what your stakeholders expect.
Here’s a 5-Factor Framework to guide you toward your team’s optimal reporting frequency - one that drives clarity without causing reporting fatigue.
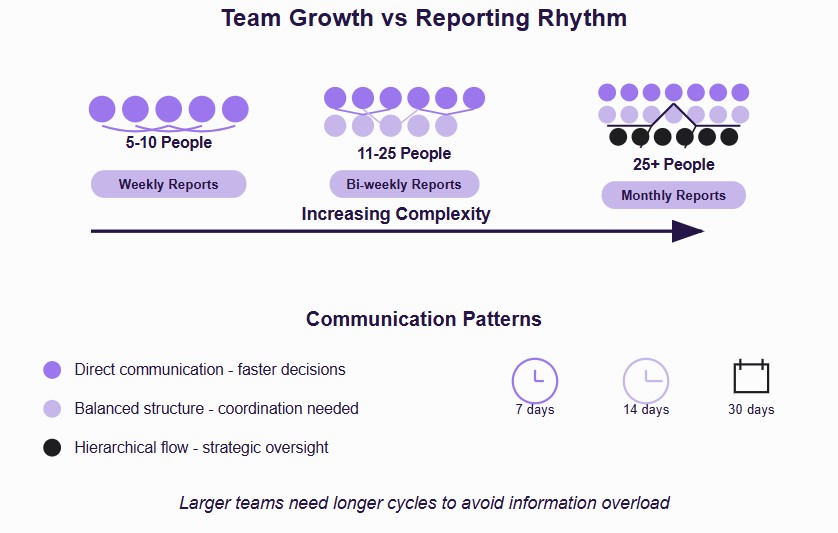
Factor 1: Team size and structure
Team size dramatically affects how often updates should be shared.
- Small teams (5–10 people): Weekly or bi-weekly reporting works best. Communication is easier, and updates can be concise and tactical.
- Medium teams (11–25 people): Bi-weekly to monthly reporting helps manage more moving parts without overwhelming everyone.
- Large teams (25+ people): A layered approach is ideal - monthly summaries for stakeholders, plus weekly status updates within sub-teams.
- Cross-functional teams: Use a hybrid cadence, aligning reporting frequency with each project phase; more frequent during launches, less during maintenance.
Pro Tip: As team size grows, clarity and hierarchy in reporting become even more critical.
Factor 2: Project complexity and duration
Not all projects are created equal; the more complex the project, the more tailored your reporting should be.
- Simple, short-term projects (1–3 months): Go for weekly updates to maintain alignment and momentum.
- Moderately complex projects (3–6 months): Bi-weekly updates offer a balance between oversight and team autonomy.
- Complex, long-term projects (6+ months): Monthly reports focused on milestone achievements work well, with optional check-ins during key transitions.
- Agile or sprint-based projects: Stick to sprint-aligned reporting - typically every 2 weeks - to reflect completed work and upcoming priorities.
Pro move: Pair reporting with sprint retrospectives or milestone reviews for maximum impact.
Factor 3: Stakeholder expectations and decision-making needs
Your reporting rhythm should also reflect who’s consuming the information and what they need it for.
- Executive stakeholders: Prefer monthly or quarterly reports that focus on strategic progress, ROI, and risk.
- Project managers: Need weekly reports for tracking progress, addressing blockers, and managing priorities.
- Team members: Benefit from daily stand-ups to stay in sync, plus weekly summaries to reflect on progress.
- External clients: Align with contractual expectations - some want weekly updates, others are fine with monthly reviews. A well-crafted stakeholder engagement plan can help define what works best for each.
Rule of thumb: The higher the decision impact, the more precise the reporting should be - not necessarily more frequent.
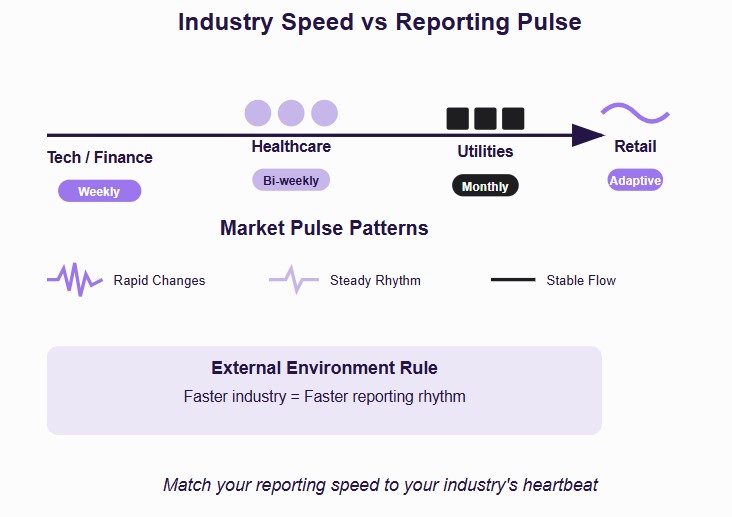
Factor 4: Industry and business environment volatility
Some industries move fast. Others are more stable. Match your cadence accordingly.
- High-volatility industries (tech, finance): Demand frequent, nimble updates to stay ahead of rapid changes.
- Stable sectors (utilities, manufacturing): Can sustain less frequent, more detailed reporting.
- Seasonal industries (e.g., retail, tourism): Should adapt reporting frequency to peak seasons - daily/weekly during high-demand periods, monthly otherwise.
Insight: Your external environment should dictate how agile your reporting cadence needs to be.
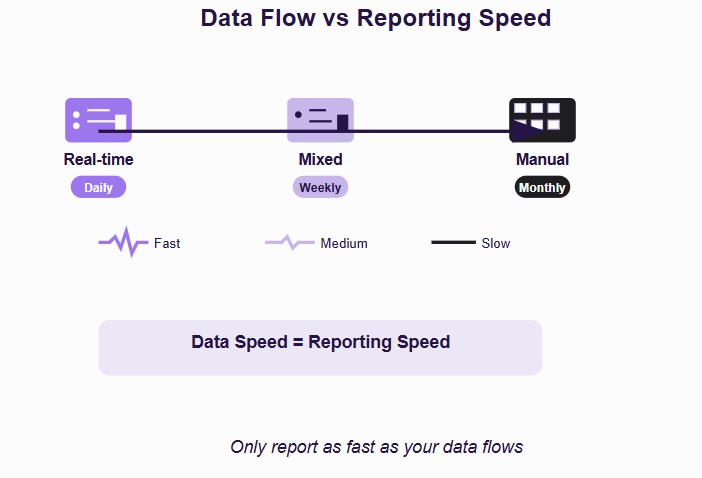
Factor 5: Data availability and quality
You can only report as often as you can collect and trust your data.
- Real-time dashboards and tools (e.g., project tracking software) allow for more frequent, lighter-touch updates.
- Manual data collection processes require less frequent but more thoughtful reports - usually weekly or monthly.
- When accuracy matters most: Prioritize precision over speed. It’s better to deliver one solid monthly report than five rushed ones.
Balance matters: Too much data, too fast, leads to noise. Too little, too late leads to misalignment.
Quick decision matrix tool: Find your team’s ideal reporting rhythm in 5 minutes
Torn between weekly, bi-weekly, or monthly reports? Use this rapid scoring system to calculate the most effective reporting frequency for your team. Just assign a score (1–5) to each area below, then add them up to find your match.
How big is your core team?
- 🟢 Small (5–10 people): Score 5 → Fast, weekly reporting works well
- 🟡 Mid-sized (11–25 people): Score 3 → Bi-weekly cadence is usually ideal
- 🔴 Large (25+ people): Score 1 → Stick to monthly summaries and targeted updates
What’s the project’s complexity and duration?
- 🟢 Simple, 1–3 month project: Score 5 → Keep it tight with weekly updates
- 🟡 Moderate, 3–6 month timeline: Score 3 → Bi-weekly rhythm strikes the balance
- 🔴 Long-term or complex (6+ months): Score 1 → Monthly with milestone-based reporting
How urgently do stakeholders need info?
- 🟢 High urgency (active decisions, blockers): Score 5
- 🟡 Moderate urgency (monitoring & alignment): Score 3
- 🔴 Low urgency (strategic-level only): Score 1
Match reporting rhythm to how fast decisions are made using your reports.
How fast does your industry move?
- 🟢 High volatility (tech, startups, finance): Score 5 → Frequent updates required
- 🟡 Moderate pace (healthcare, services): Score 3
- 🔴 Stable industries (manufacturing, utilities): Score 1
Volatile = rapid updates. Stable = longer reporting cycles.
How accessible is your reporting data?
- 🟢 Real-time dashboards and automation tools: Score 5
- 🟡 Some automation, some manual work: Score 3
- 🔴 Mostly manual or delayed data collection: Score 1
Frequent reporting only works if you have fast, accurate data.
Your reporting frequency results
Total Score → Recommended Frequency:
- 20–25 points: 🔄 Weekly reporting + daily standups (great for fast-moving teams)
- 15–19 points: 📆 Bi-weekly reporting + weekly check-ins (ideal for mixed-complexity projects)
- 10–14 points: 🗓️ Monthly reporting + bi-weekly team syncs (best for steady projects)
- 5–9 points: 🧭 Quarterly reporting + monthly updates (perfect for strategic oversight)
Start with your calculated frequency for 30 days, then adjust based on team feedback and results. The perfect frequency is the one that maximizes decision quality while minimizing reporting overhead.
Stop making these fatal reporting frequency mistakes (before they kill your team's productivity)
Your reporting frequency can make or break your team's performance. Most teams unknowingly fall into these four critical traps that waste time, frustrate stakeholders, and derail projects. Here's how to spot and fix them immediately.
Mistake #1: Reporting without clear goals (the "Checkbox syndrome")
Warning Signs:
- Team members ask, "Why are we reporting this?" during meetings
- Reports contain the same information week after week, with no action taken
- Nobody references previous reports when making decisions
- Reports feel like busy work rather than valuable communication
The Fix: Align Reports with Decision-Making Points
Map your decision calendar and match reporting frequency to actual decision needs. Don't report weekly if decisions happen monthly.
Create purpose-driven templates that start with: "This report helps you decide..." and end with specific asks: "We need decisions on..."
Implement the "So What?" test: Before sending any report, ask, "What action should this information drive?" If you can't answer clearly, don't send it.
Mistake #2: Too frequent updates = team burnout (the "over-communication trap")
Warning Signs:
- Team complains about "spending more time reporting than working"
- Report quality decreases over time (shorter, less detailed, copy-paste content)
- People start missing deadlines or submitting incomplete information
- Team energy visibly declines during reporting periods
The Fix: Trim to Essentials with Smart Thresholds
Use exception-based reporting: Set clear thresholds for when to report (budget variance >5%, timeline delay >2 days). Create "no news is good news" protocols where team members only report when exceptions occur.
Batch similar updates into a single, comprehensive report rather than multiple quick updates.
Replace daily status emails with weekly comprehensive reports plus exception-based alerts. Most teams see a 30-50% reduction in reporting time with better visibility.
Mistake #3: Too infrequent = missed blockers (the "Ostrich strategy")
Warning Signs:
- Problems escalate before being addressed (small issues become big crises)
- Stakeholders are surprised by project delays or budget overruns
- Team members feel disconnected from the overall progress
- You discover critical issues weeks after they started impacting work
The Fix: Use Smart Check-In Triggers
Create trigger-based check-ins rather than calendar-based ones. Set up automatic alerts when key metrics hit thresholds:
- ⚠️ Yellow Alert: Any task >20% behind schedule triggers team check-in
- 🚨 Red Alert: Any blocker lasting >48 hours triggers stakeholder escalation
Use "traffic light" reporting: Green means no update needed, yellow means watching closely, red means immediate attention required. Stakeholders only need to read the yellow and red updates, especially in fast-paced departments using sales project management tools to manage dynamic targets.
Implement lightweight pulse checks: 15-minute weekly sessions focusing only on blockers and risks, plus monthly comprehensive reviews.
Mistake #4: Static cadence in dynamic environments (the "set it and forget it" trap)
Warning Signs:
- Your reporting frequency hasn't changed despite major project shifts
- You use the same schedule for discovery, execution, and maintenance phases
- Some periods feel over-managed, while others feel under-managed
- External factors shift rapidly, but reporting doesn't adapt
The Fix: Build Adaptive Reporting Systems
Map your project phases and design phase-specific frequencies:
- Planning phase: Daily strategy sessions + weekly stakeholder updates
- Execution phase: Weekly team reports + bi-weekly stakeholder updates
- Maintenance phase: Monthly reports + exception-based alerts
Create escalation protocols that automatically adjust frequency based on risk levels and project phases.
Schedule quarterly reporting reviews to evaluate effectiveness and adjust based on upcoming phases and external factors.
Build better reports: What to include at every reporting frequency
Great reports don’t overwhelm; they inform, align, and drive decisions. But what you include depends heavily on how often you report. A daily standup should look nothing like a quarterly executive review. To make your reporting cadence work, you need the right content at the right level.
Below is a clear breakdown of what to include in reports at each common frequency. Whether you're syncing daily or presenting quarterly, use this as your blueprint to keep every report lean, useful, and decision-focused.
Final Tip:
Never treat reporting as a formality. Each report is an opportunity to align teams, inform stakeholders, and drive smart decisions, but only when tailored to its audience and cadence.
Start with frequency. Match the depth. Keep it focused, and if you’re unsure how to visualize it all at a glance, use a project canvas template to bring structure and clarity.
Let reporting drive action, not just documentation
The right reporting frequency isn’t about checking boxes; it’s about driving clarity, alignment, and momentum. By considering team size, project complexity, stakeholder needs, industry pace, and data quality, you can set a cadence that actually serves your team.
Use the decision matrix, avoid the common pitfalls, and match report content to each rhythm. When reporting is purpose-driven, it stops being noise and starts being a tool for real progress.
_light%201.png)