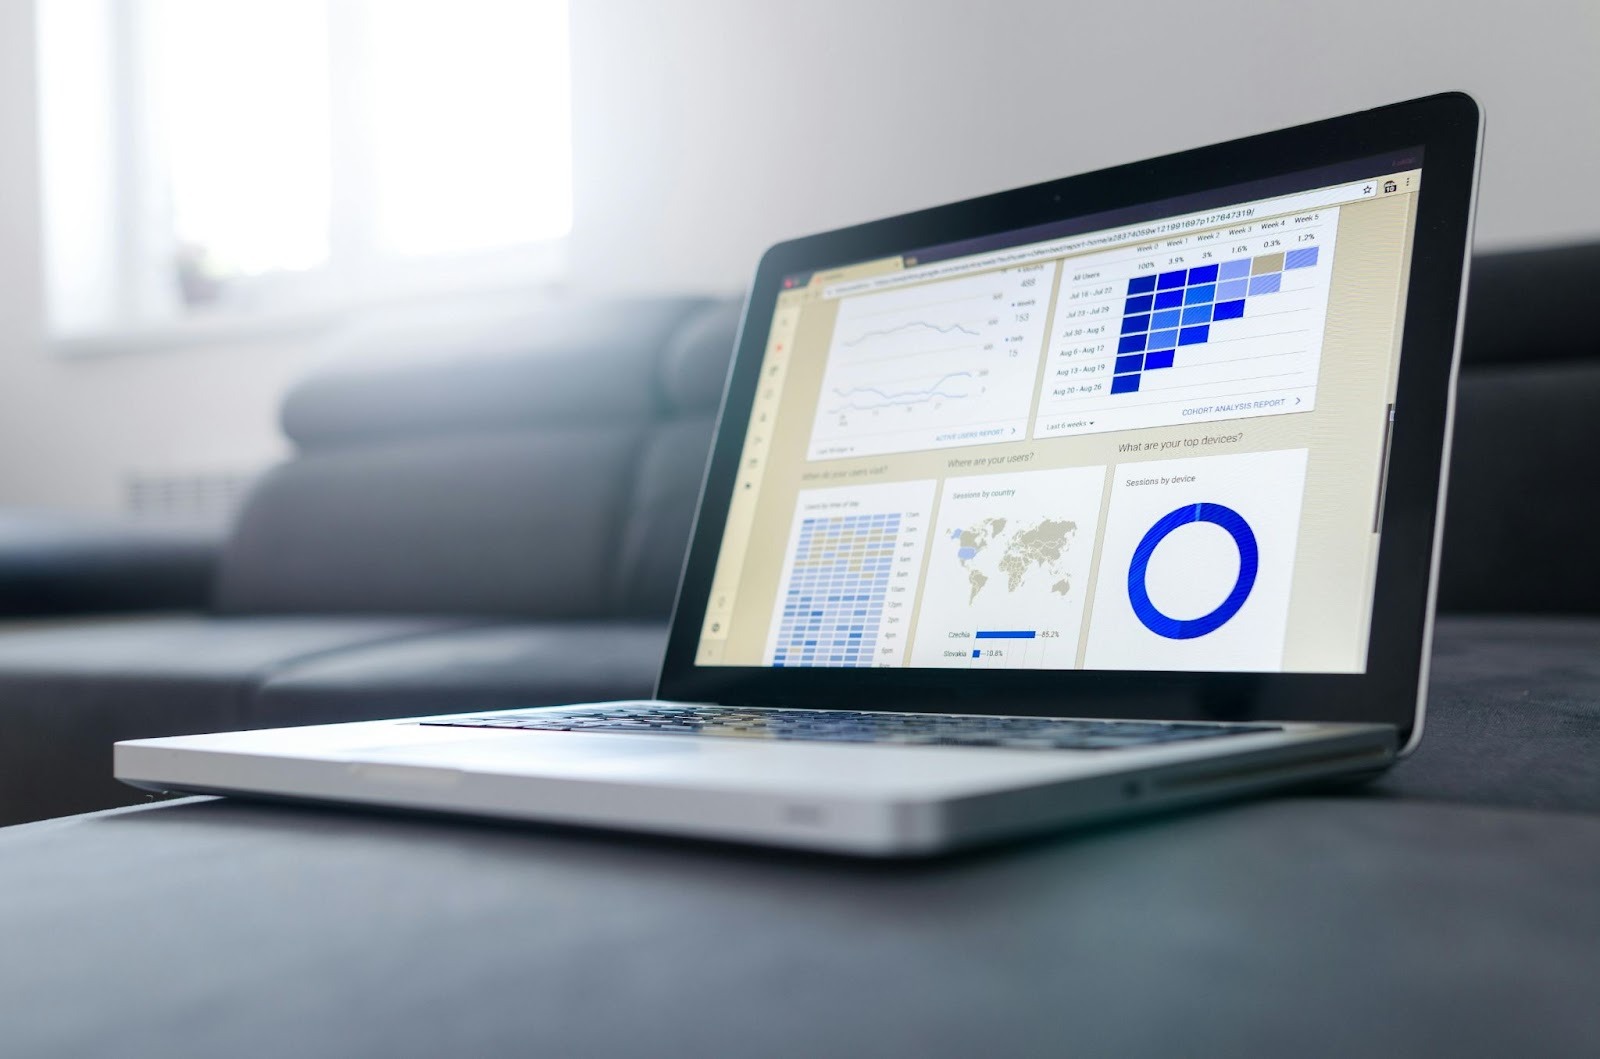
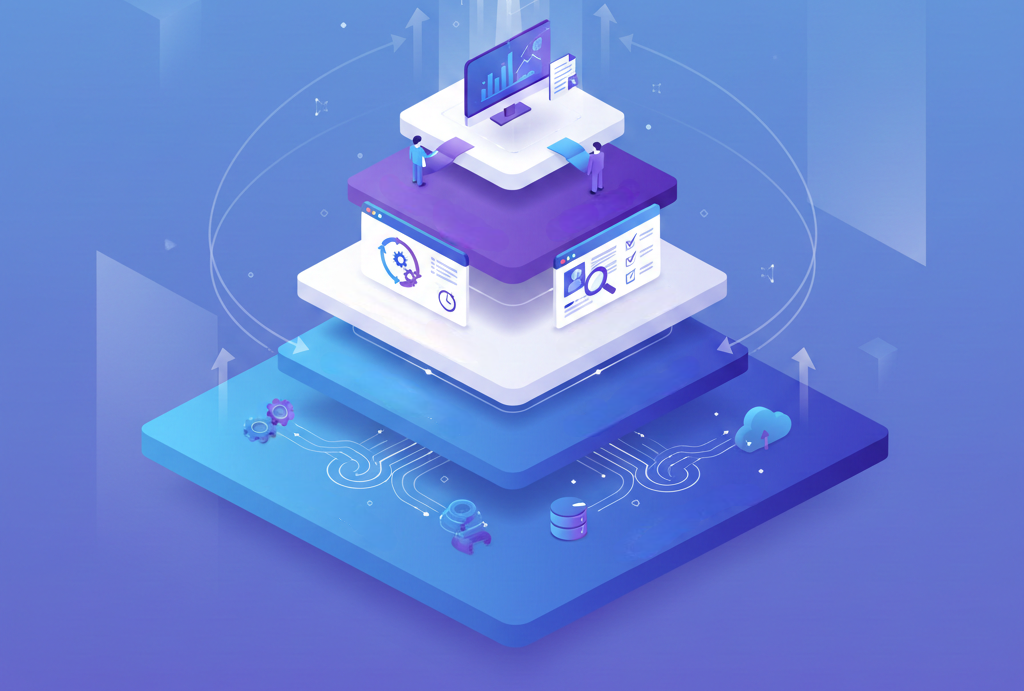
Managing projects without real-time visibility is like driving with a foggy windshield. You know you're moving, but you can't see clearly where you're headed or what obstacles lie ahead.
Manual dashboard creation eats up valuable time. Teams spend hours collecting data, updating spreadsheets, and creating outdated reports the moment they're finished. This approach doesn't scale, and it certainly doesn't help you make faster decisions.
Learning how to automate project dashboard creation changes everything. Your data updates automatically, stakeholders get instant insights, and your team can focus on actual work instead of reporting on work.
Why automate your project dashboards?

Automation shifts you from chasing data to using it. Instead of spending hours compiling reports, you can make decisions while your dashboards update themselves.
Here's what that shift gives you.
Time savings that compound
Manual reporting takes anywhere from 5 to 15 hours per week for most project managers. That's time you're not spending on strategic planning, team development, or addressing actual project risks.
Dashboards automate data collection and reporting, eliminating the need to manually compile information from various sources. This time savings compounds as your project portfolio grows.
Real-time accuracy
Static reports are snapshots of the past. By the time you finish creating them, they're already outdated. An AI project management tool with automated dashboard updates whenever task statuses change, giving you a living view of project health.
You'll catch issues early, respond to changes faster, and make decisions based on current data rather than yesterday's numbers.
Reduced human error
Manual data entry and reporting create countless opportunities for mistakes. Copying numbers incorrectly, using outdated formulas, or pulling from the wrong data source can lead to flawed decisions.
Automated dashboards eliminate human errors and inconsistencies that plague manual reporting. Your stakeholders get consistent, reliable information every time.
Better stakeholder engagement
When executives and clients can access the current project status anytime they want, you get fewer status meetings and email requests. They become more engaged because the information is always available and easy to understand.
Core components of automated dashboards

Understanding what makes automated dashboards work helps you build better ones.
Data integration layer
This is where automation begins. Your dashboard needs to pull information from wherever your project data lives.
Common data sources include:
- Time tracking systems (like Toggl)
- Financial tools
- Communication platforms (such as Slack and Microsoft Teams)
- Code repositories (example: GitHub)
- Customer relationship management systems
Native integrations with development tools, communication platforms, and business systems ensure data flows automatically without manual updates.
Automated data refresh
Your dashboard is only as good as the freshness of its data. Automated refresh ensures you're always looking at current information.
There are several refresh approaches:
- Scheduled refresh: Data updates at predetermined intervals (hourly, daily, weekly). This works well for stable metrics that don't change minute-by-minute.
- Event-triggered refresh: Updates happen when specific events occur, like a status change. Perfect for fast-moving projects where timing matters.
- Real-time refresh: Data streams continuously to your dashboard. Organizations utilizing real-time dashboards see significant improvement in decision-making speed.
Visualization layer
Raw data doesn't help anyone. Your dashboard needs to translate numbers into visual insights that people can understand quickly.
Key visualization elements:
Alert and notification system
Passive dashboards wait for you to check them. Smart dashboards reach out when they need your attention.
Trigger-based report generation automatically creates reports when specific events occur, like sales targets being met or performance criteria being reached.
Set up alerts for:
- Crossed budget thresholds
- Missed or approaching deadlines
- Resource allocation issues
- Quality metrics falling below standards
- Negatively trending risk indicators
Step-by-step automation implementation

Let's walk through building an automated dashboard system from scratch.
Step 1: Define your metrics
Don't try to track everything. Start with metrics that directly impact project success.
Essential project metrics:
- Project health score (on track, at risk, critical)
- Budget vs. actual spending
- Timeline adherence
- Task completion rate
- Resource utilization
- Risk exposure level
- Stakeholder satisfaction score
Focus on metrics that matter most to your business and team, as too many KPIs or irrelevant data points overwhelm users.
Step 2: Connect your data sources
Map out where each metric lives. You might pull budget data from your accounting system, task execution from your PM tool, and time tracking from a separate platform.
Modern platforms offer multiple integration methods:
- Pre-built connectors: Most dashboard tools provide ready-made integrations with popular platforms. These require minimal technical setup.
- API connections: APIs allow businesses to import data from external sources into internal systems, enabling custom integrations when pre-built options don't exist.
- Webhooks: These provide event-driven updates. When something changes in your source system, it immediately notifies your dashboard.
- Data export and import: For systems without direct integration, automated data exports can feed into your dashboard on a schedule.
Step 3: Set up automated workflows
This is where the magic happens. Configure your system to handle data collection, processing, and updates without manual intervention.
Workflow automation connects various applications and systems to automate tasks and exchange information seamlessly.
Key workflows to automate:
- Daily data refresh workflow
- Alert workflow
- Report generation workflow
Step 4: Design for clarity
A cluttered dashboard is worse than no dashboard. Design with purpose.
Best practices for dashboard design:
- Put the most critical metrics at the top
- Use color purposefully (green for good, yellow for caution, red for problems)
- Include context with your numbers (vs. target, vs. last period)
- Make it scannable in under 30 seconds
- Provide drill-down options for details
- Use consistent formatting throughout
👉Not a designer? Start with a project dashboard template that already incorporates these principles.
Step 5: Test and validate
Before rolling out to your team, validate everything works correctly.
Testing checklist:
- Data accuracy (compare against source systems)
- Refresh reliability (ensure updates happen on schedule)
- Alert functionality (verify triggers fire correctly)
- Performance (check load times and responsiveness)
- Access permissions (confirm security settings)
- Mobile compatibility (test on different devices)
Step 6: Train and deploy
Even the best dashboard fails if people don't know how to use it.
Effective rollout includes:
- Live demonstration sessions
- Written documentation with screenshots
- Quick reference guides
- Support channel for questions
Unlock advanced automation strategies
Once you've mastered the basics, these advanced techniques take your dashboards further.
AI-powered insights

Machine learning algorithms can identify patterns that humans miss. AI-driven predictive analytics learns from data trends and acts without manual approval.
Applications:
- Predicting project delays before they occur
- Identifying resource bottlenecks
- Forecasting budget overruns
- Suggesting optimal task assignments
Cross-project portfolio views
Don't stop at individual project dashboards. Create portfolio-level views that aggregate data across all projects.
Portfolio overviews combine data from multiple project boards into a single high-level dashboard tracking overall progress and resource allocation.
This helps executives:
- Prioritize resource allocation
- Identify struggling projects early
- Compare project performance
- Make strategic portfolio decisions
Custom metrics and KPIs
Generic dashboards provide generic insights. Build custom metrics that reflect your specific project methodology and business goals.
Examples of custom metrics:
- Velocity-adjusted completion rate
- Risk-weighted timeline estimates
- Client engagement score
- Technical debt accumulation
- Team morale indicators
Embedded dashboards
Instead of forcing people to visit a separate dashboard tool, bring insights directly into their existing workflows.
Dashboards support embedding to integrate into company intranets, websites, documents, or presentations.
Embed dashboards in:
- Project management tools
- Internal wikis and knowledge bases
- Team communication channels
- Executive presentations
- Client portals
Conditional automation
Create smart workflows that respond differently based on context.
Example conditional logic:
- If the project is more than 10% over budget AND less than 50% complete, escalate to the sponsor
- If a task is overdue by more than 3 days, reassign automatically
- If team velocity drops below 80% of the average, trigger a retrospective meeting
- If the client satisfaction score falls below 7, send a recovery action plan
Measuring project dashboard automation success
You've invested time building automated dashboards. You've connected data sources, configured workflows, and trained your team. Now comes the critical question: How do you know if it's actually working?
Quantitative metrics
Track these numbers to measure impact:
Qualitative indicators
Numbers don't tell the whole story. Watch for these signs of success:
- Team members reference the dashboard in meetings without prompting
- Stakeholders make data-driven decisions faster
- Fewer "status update" meetings needed
- Questions become more sophisticated
- People ask for dashboard access proactively
- Transparency improves team morale
ROI calculation
Make the business case for automation by calculating return on investment.
Here's a sample calculation for a mid-sized team. Your actual numbers will vary based on your hourly rates, team size, and project complexity:
Time savings: 10 hours/week × $75/hour × 52 weeks = $39,000/year
Error reduction: 2 major mistakes avoided × $50,000 impact = $100,000/year
Faster decision-making: 2 days faster response time × 24 decisions/year × $10,000 value = $480,000/year
Total annual benefit: $619,000
Investment cost: Dashboard platform ($15,000) + setup ($25,000) + maintenance ($10,000/year) = $50,000
First-year ROI: ($619,000 - $50,000) / $50,000 = 1,138%
The future of dashboard automation

Dashboard automation continues evolving rapidly.
Here are some of the emerging trends:
- Natural language interfaces: Soon you'll ask questions in plain English and get instant dashboard insights.
- Predictive analytics: Dashboards will not just show what happened, but forecast what will happen.
- Self-service automation: Non-technical users will build sophisticated automations without coding.
- Enhanced mobile experiences: Dashboards will work seamlessly across all devices with optimized mobile interfaces.
- Collaborative features: Teams will annotate, discuss, and make decisions directly within dashboards.
Ready to automate your dashboards?
Automated project dashboards transform how teams work. They eliminate hours of manual reporting, provide real-time visibility, and empower faster decision-making.
The best part? You can start today with the tools and strategies in this guide.
Pick one project. Connect your data sources. Build a simple dashboard. The time you invest now multiplies with every automated update, every instant alert, and every stakeholder who finds answers without asking you.


%20(1).jpg)
_light%201.png)


