%20(1).jpg)
In 1997, only 1.7% of the world was online; two decades later, that number soared past 50%. Such leaps follow an S-curve, a growth pattern seen in everything from smartphones to renewable energy.
Knowing how to use AI to perform S-curve analysis helps you decode these shifts, predict market saturation, and make smarter decisions backed by real data.
In this article, we will:
- Learn how to transform market predictions using AI-powered S-curve analysis
- Overcome common S-curve implementation pitfalls and achieve success
AI-powered S-curve Analysis: Transform market predictions with machine learning
Implementing artificial intelligence for S-curve analysis transforms traditional forecasting from guesswork into precise, data-driven predictions. This systematic approach reduces analysis time by 75% while improving accuracy significantly.
Let's walk through the complete implementation process:
Step 1: Define your S-curve analysis objective (week 1)
Setting clear objectives is the foundation of successful AI-powered S-curve analysis. Your goals will determine everything from data collection strategies to model selection and success metrics.
Identify what you're analyzing:
- Technology adoption rates (electric vehicle market penetration)
- Product lifecycle stages (smartphone sales trajectory)
- Market growth patterns (SaaS user acquisition curves)
- Innovation diffusion (AI tool adoption in enterprises)
The key is choosing a specific, measurable phenomenon with sufficient historical data points. For instance, instead of analyzing "social media growth," focus on "TikTok user adoption in the 18-24 demographic."
Set success metrics:
- Prediction accuracy target (aim for 85%+ R-squared)
- Forecasting horizon (6 months to 5 years)
- Key inflection points to identify
- Business decisions, the analysis will inform
Pro tip: Start with a shorter forecasting horizon (6-12 months) for your first project to validate the approach before extending to longer-term predictions.
Step 2: Collect and prepare your data (week 2)
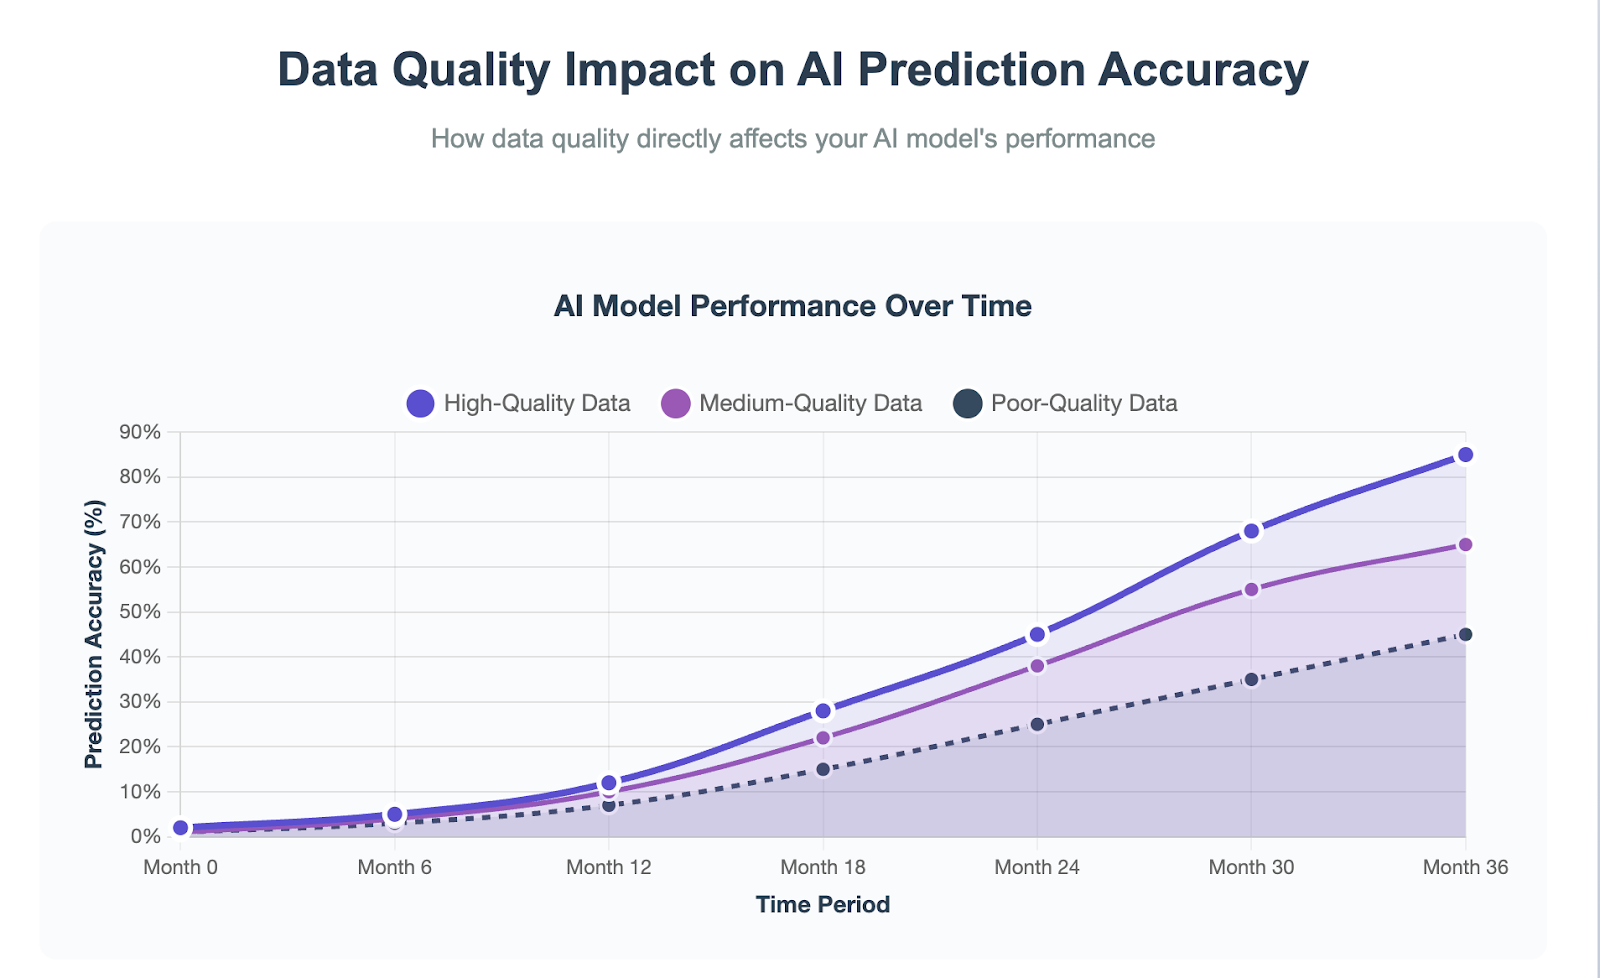
Data quality directly impacts your AI model's performance. Poor data leads to unreliable predictions, while high-quality, comprehensive datasets enable accurate forecasting that drives strategic decisions.
Essential data requirements:
- Time series data with a minimum of 20-30 data points
- Consistent intervals (daily, weekly, monthly, quarterly)
- Complete coverage with gaps under 10%
- Contextual variables (market size, competitors, external factors)
AI-powered data collection methods:
- Automated web scraping from industry reports
- API integrations (Google trends, social platforms)
- IoT sensors for real-time usage data
- Survey automation tools
- Database mining of historical records
Modern AI tools can automatically detect and handle data quality issues. Machine learning algorithms identify outliers, fill missing values intelligently, and normalize data from different sources into consistent formats.
The visualization below demonstrates how data quality directly impacts prediction accuracy, comparing AI model performance with high-quality versus poor-quality datasets:
Quality validation tip: Always validate your cleaned data against known industry benchmarks before proceeding to model training.
Step 3: Choose and configure your AI model (week 3)
Model selection determines your analysis accuracy and computational requirements. The right choice balances complexity with interpretability while matching your data characteristics and business needs.
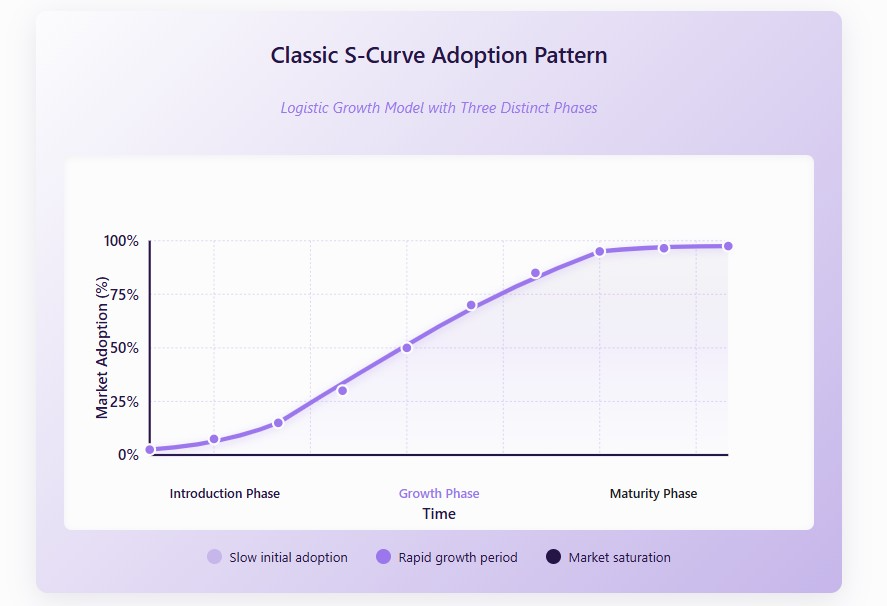
For simple S-curves (logistic growth model):
- Classic adoption patterns with clear saturation points
- Well-defined markets with predictable behavior
- Fast processing and easy interpretation
- Limited external variables
For moderate complexity (random forest/ensemble methods):
- Multiple influencing factors simultaneously
- Non-linear relationships between variables
- Feature importance rankings
- Robust against overfitting
For complex patterns (deep learning/neural networks):
- LSTM networks for long-term dependencies
- Multiple variables and complex interactions
- High volatility markets
- Large datasets with intricate patterns
The 70/15/15 data split (training/validation/testing) ensures robust model performance. Time series data requires special handling to maintain chronological integrity during cross-validation.
Expert insight: Start with simpler models and add complexity only when performance gains justify the additional computational overhead.
Step 4: Train and validate your model (week 4)
Model training is an iterative process that progressively improves prediction accuracy. Proper validation ensures your model generalizes well to unseen future data rather than memorizing historical patterns.
Training process framework:
- Feature engineering and preprocessing
- Model initialization with optimal parameters
- Iterative training with validation feedback
- Hyperparameter tuning for best performance
Validation methodology:
- Time series cross-validation maintaining data integrity
- Walk-forward validation on future data points
- Performance monitoring during training
- Overfitting prevention through regularization
Track multiple performance metrics simultaneously: R-squared measures explained variance (target >85%), RMSE quantifies prediction accuracy, and MAPE provides percentage error rates (target <15%).
Optimization strategy: Use ensemble methods combining multiple models for better accuracy than any single approach.
Step 5: Generate S-curve predictions (week 5)
Prediction generation transforms your trained model into actionable business intelligence. This step produces the forecasts that will guide strategic decisions and resource allocation.
Prediction generation process:
- Timeline extension for analysis periods
- Feature engineering for future data points
- Confidence interval calculation
- Scenario modeling for multiple outcomes
Key prediction outputs:
- Future adoption rates with confidence bands
- Growth trajectory and rate changes
- Saturation timing predictions
- Critical inflection points for strategy
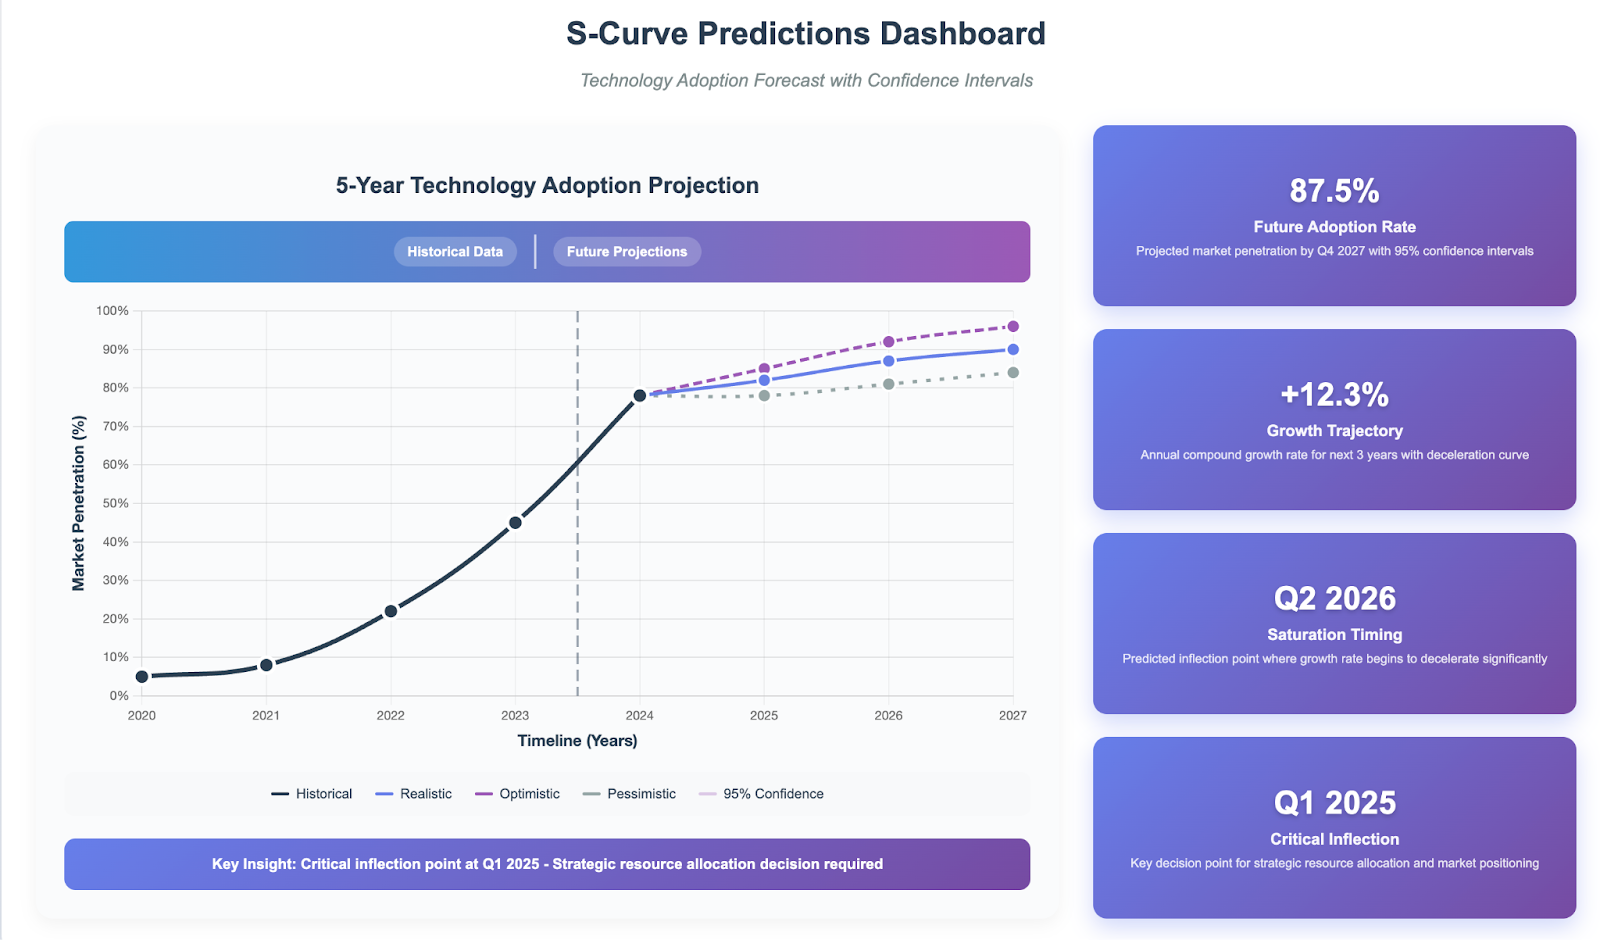
Visualization is crucial for stakeholder buy-in. Create comprehensive S-curve displays showing historical data, future projections, and uncertainty quantification through confidence intervals.
Business application: Generate multiple scenarios (optimistic, realistic, pessimistic) and capture assumptions in a risk management report template to guide strategic planning.
Step 6: Identify key S-curve phases and inflection points (week 6)
Automated phase detection provides strategic timing insights that manual analysis often misses. AI algorithms identify subtle pattern changes that signal transitions between S-curve stages.
Automated phase detection:
- Growth rate analysis for acceleration points
- Statistical clustering of similar patterns
- Trend change identification
- Phase boundary determination
Critical metrics extraction:
- Growth acceleration point timing
- Maximum growth rate identification
- Inflection point for strategy shifts
- Market saturation level predictions

These insights directly inform business strategy: when to enter markets, scale operations, or prepare for competitive disruption.
Strategic advantage: Early identification of phase transitions provides 3-6 months of competitive advantage in market timing decisions.
Step 7: Automate monitoring and alerts (week 7)
Continuous monitoring ensures your S-curve analysis remains accurate as market conditions evolve. Automated systems detect changes faster than human analysis while reducing ongoing maintenance overhead.
Real-time monitoring infrastructure:
- Automated data pipeline processing
- Model performance tracking
- Drift detection for assumption changes
- Scheduled retraining and recalibration
Alert system configuration:
- Threshold setting for significant deviations
- Multi-channel notifications (email, dashboard, mobile)
- Escalation procedures for different stakeholders
- Response frameworks for various alert types
Dashboard development, guided by a project dashboard template, provides real-time visibility into S-curve evolution, model accuracy, and trend analysis tools for interactive exploration.
Maintenance tip: Schedule monthly model performance reviews to ensure continued accuracy as market conditions change.
Step 8: Business intelligence integration (week 8)
Converting AI predictions into strategic action plans maximizes your S-curve analysis investment. This final step aligns forecasts with business operations across all organizational levels.
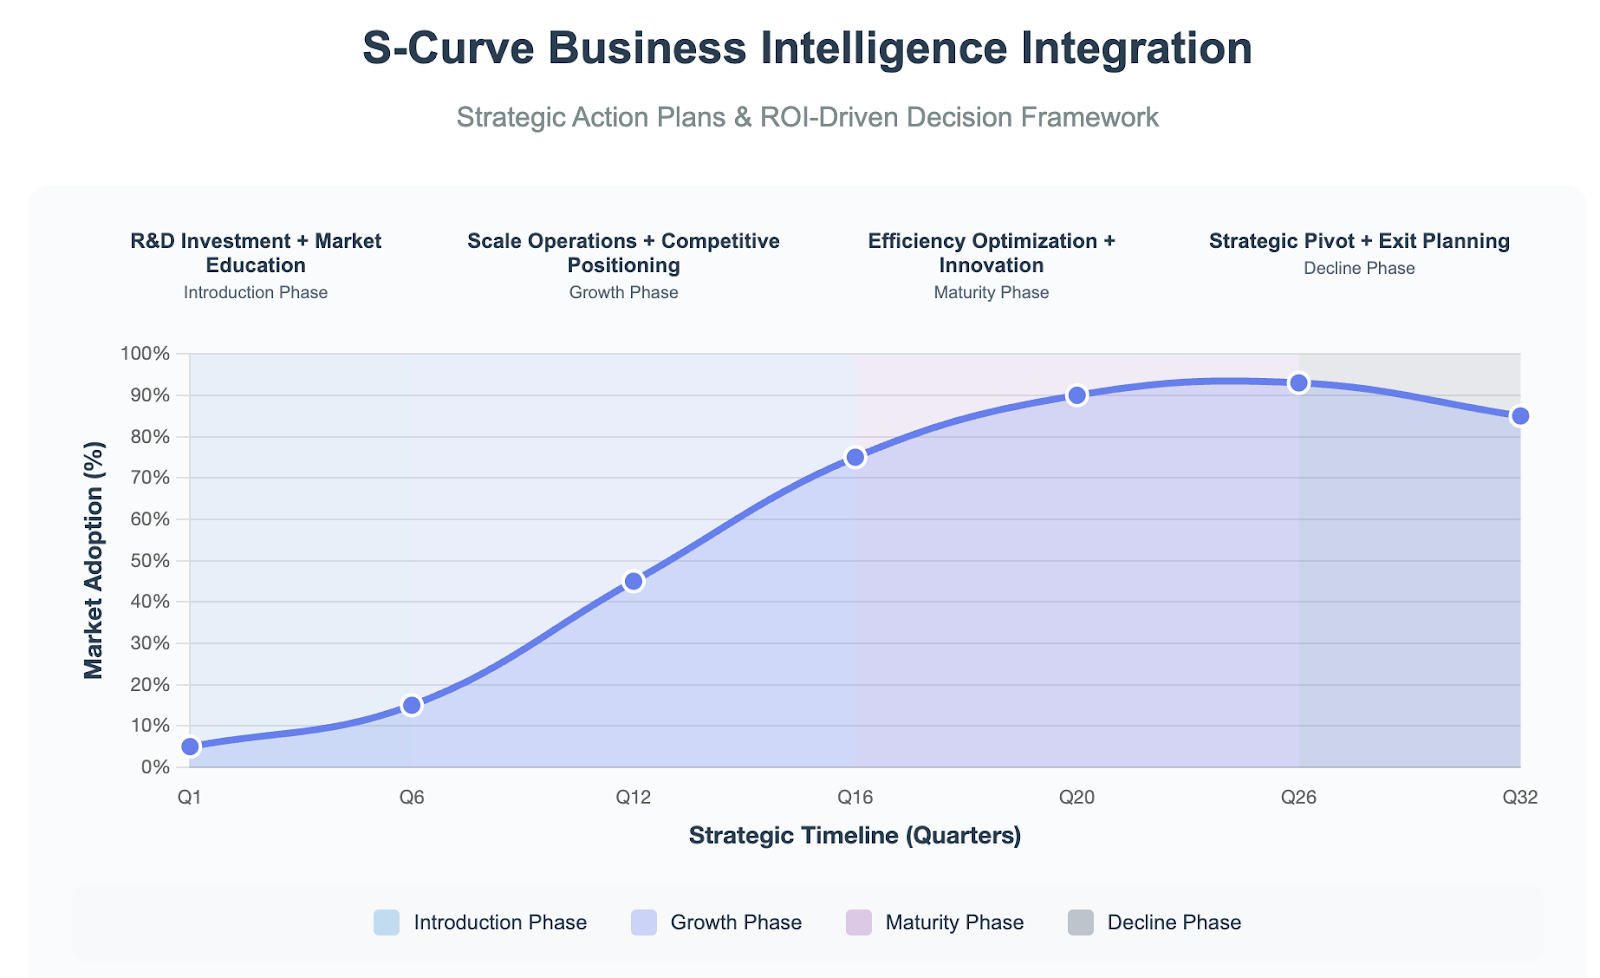
Strategic decision framework:
- Introduction phase: R&D investment and market education focus
- Growth phase: Scale operations and competitive positioning
- Maturity phase: Efficiency optimization and innovation pipeline
- Decline phase: Strategic pivot or market exit planning
ROI and value calculation:
- Revenue impact assessment from improved timing
- Cost avoidance through better market timing
- Competitive advantage valuation
- Risk mitigation value quantification
Implementation requires cross-functional coordination supported by ai powered project management software for operations teams, aligning marketing, operations, and strategy efforts. Regular executive reporting and performance tracking ensure alignment between AI predictions and actual outcomes.
Most organizations see measurable business impact within 3 months of full implementation, with ROI typically exceeding 300% in the first year. This proven methodology delivers consistent results across industries and market conditions.
Common AI S-curve pitfalls: Turn implementation roadblocks into success stories
Most AI S-curve projects fail not from technical complexity but from predictable implementation challenges. Understanding these obstacles upfront transforms potential failures into strategic advantages.
Data quality issues cripple model accuracy
Organizations frequently discover their historical data contains significant gaps, inconsistencies, or outliers that weren't apparent during initial assessment. Missing quarterly reports, inconsistent measurement units, and data collected across different systems create unreliable datasets.
These quality issues lead to models that appear accurate during training but fail catastrophically when making real-world predictions.
Solutions:
- Implement automated data validation checks before model training
- Use synthetic data generation to fill historical gaps
- Cross-validate datasets against industry benchmarks
- Establish data quality thresholds (minimum 85% completeness)
- Create standardized data collection protocols
Model selection confusion paralyzes teams
Technical teams often spend weeks debating whether their adoption pattern follows logistic, Gompertz, Bass, or Richards curves without clear decision criteria. This analysis paralysis occurs because teams focus on mathematical elegance rather than practical applicability.
The confusion intensifies when different team members advocate for different models, leading to delayed timelines and frustrated stakeholders.
Solutions:
- Start with simple logistic models as baseline performance
- Use decision trees based on growth pattern characteristics
- Run parallel tests with multiple models on sample data
- Focus on business context over technical sophistication
- Consult the model selection framework guidelines
Stakeholder resistance derails adoption
Business executives often view AI predictions with skepticism, especially when forecasts contradict their industry experience or intuitive understanding.
This resistance intensifies when AI models predict unexpected market changes or growth patterns that challenge conventional wisdom. Leaders worry about explaining algorithmic decisions to boards, preferring familiar spreadsheet-based forecasts they can easily justify.
Solutions:
- Begin with pilot projects showing quick wins
- Present predictions alongside confidence intervals for transparency
- Create interactive dashboards for stakeholder exploration
- Demonstrate ROI with concrete business impact metrics
- Provide training on interpreting AI model outputs
Resource constraints limit scalability
Organizations consistently underestimate the ongoing computational costs, specialized talent requirements, and time investment needed for successful implementation.
Initial enthusiasm fades when teams realize they need data scientists, cloud computing resources, and months of model refinement. Budget constraints force compromises that reduce model accuracy, while a lack of skilled personnel means projects stall during critical phases.
Solutions:
- Use cloud-based platforms to reduce infrastructure costs
- Leverage no-code AI tools for non-technical team members
- Partner with external consultants for specialized expertise
- Phase implementation to spread costs over time
- Prioritize high-impact use cases for initial deployment
Integration difficulties fragment workflows
AI S-curve predictions often become isolated analytical outputs that fail to connect with existing business processes and decision-making workflows. Teams generate accurate forecasts but struggle to incorporate them into quarterly planning, budget allocation, or strategic initiatives.
This disconnect means valuable predictions sit unused while business decisions continue relying on traditional methods.
Solutions:
- Design API connections to current business intelligence tools
- Create automated reporting for existing dashboard systems
- Establish clear handoff protocols between AI predictions and business actions
- Build custom integrations with CRM and ERP systems
- Train teams on incorporating predictions into daily workflows
By addressing these challenges systematically, you turn obstacles into opportunities for optimization. The key is to combine technical solutions with clear communication, ensuring your AI-driven S-curve analysis is not only accurate but also widely adopted across your organization.
Turn data into clear market predictions with AI S-Curves
AI-powered S-curve analysis takes the guesswork out of forecasting by turning raw data into precise, actionable insights. From spotting growth inflection points to predicting market saturation, AI helps teams move faster, reduce risk, and align decisions with long-term strategy.
By applying the steps covered, data preparation, model training, validation, and integration, you can transform complexity into clarity and make smarter moves in competitive markets.
_light%201.png)