.jpg)
Predicting project timelines is tough. You plan for tasks to take a specific amount of time, but then reality hits.
Team members get sick. Suppliers delay deliveries. Technical problems pop up out of nowhere. Before you know it, your carefully crafted schedule is completely off track.
This is why it's important to understand what a probabilistic scheduling technique in management is. Instead of pretending we can predict the future with certainty, this approach embraces uncertainty and uses it to create more realistic project plans.
Understanding the probabilistic scheduling approach
Think of probabilistic scheduling as planning for multiple futures instead of just one.
Traditional scheduling says, "This task will take exactly 10 days."
Probabilistic scheduling says, "This task will most likely take 10 days, but it could take anywhere from 7 to 15 days depending on what happens."
The approach uses statistical models and probability distributions to predict project outcomes. You're not just getting one completion date, but you're getting a range of possible dates, with the likelihood of each one.
The differences between deterministic and probabilistic scheduling methods

To appreciate probabilistic scheduling, it helps to understand what it replaces:
Deterministic scheduling works great when you're doing something you've done many times before. You know exactly how long things take because you've got solid historical data.
But when inherent uncertainty is high? That's when probabilistic scheduling shines.
The main probabilistic scheduling techniques and tools
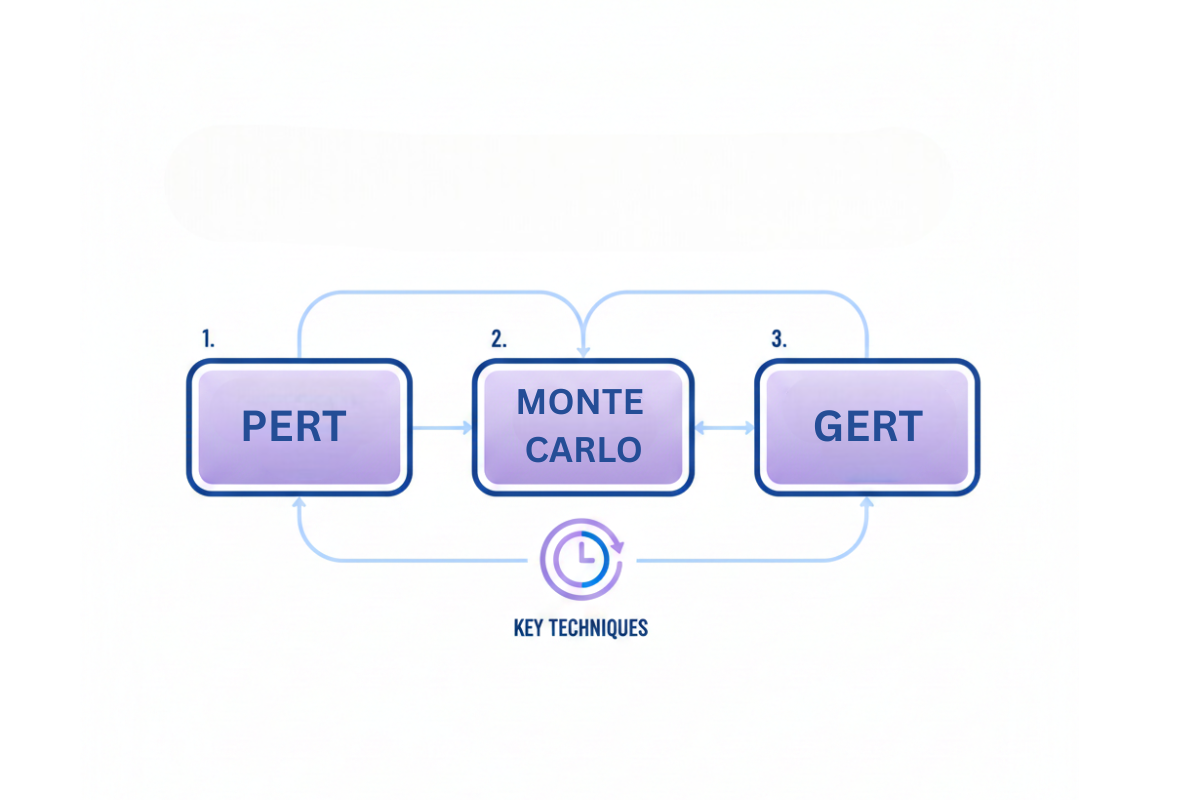
Several established methods help project managers implement probabilistic scheduling. Each has unique characteristics suited to different project types and uncertainty levels.
Program evaluation and review technique (PERT)
PERT is probably the most well-known probabilistic scheduling method. It was developed back in the 1950s for the U.S. Navy's Polaris missile program.
Here's how it works:
Step 1: Get three estimates for each task
- Optimistic estimate (O): Everything goes perfectly. No delays, no problems.
- Most likely estimate (M): Normal conditions. This is what you realistically expect.
- Pessimistic estimate (P): Murphy's Law kicks in. Everything that can go wrong does.
Step 2: Calculate the expected duration
PERT uses this formula:
Expected Duration = (O + 4M + P) ÷ 6
Notice the "4M" part? That's because the most likely scenario gets more weight; it's statistically more probable than the extremes.
Step 3: Calculate the standard deviation
Standard Deviation = (P - O) ÷ 6
This tells you how much uncertainty exists. A bigger number means more risk.
Example in action:
Let's say you're developing a new website feature:
- Optimistic: 5 days
- Most likely: 8 days
- Pessimistic: 17 days
Expected duration = (5 + 32 + 17) ÷ 6 = 9 days
Standard deviation = (17–5) ÷ 6 = 2 days
This means you can expect the task to take about 9 days, with a variability of ±2 days.
🛠️ Tool Tip: Skip the manual math. Use our Three-Point Estimation Calculator to instantly generate your expected durations and standard deviations.
When to use PERT:
- Complex projects with lots of uncertainty
- Research and development initiatives
- First-time projects without historical data
- Aerospace, defense, and construction projects
Monte Carlo simulation
If PERT is good, Monte Carlo simulation is great, but it requires more computing power.
Think of it as running your project thousands of times in a computer simulation to see what happens.
How Monte Carlo simulation works:
- Define probability distributions for each task: Instead of three estimates, you define a full range of possible durations and how likely each one is.
- Run the simulation thousands of times: The software randomly picks duration values from your defined ranges and calculates the total project duration. It does this 10,000 times or more.
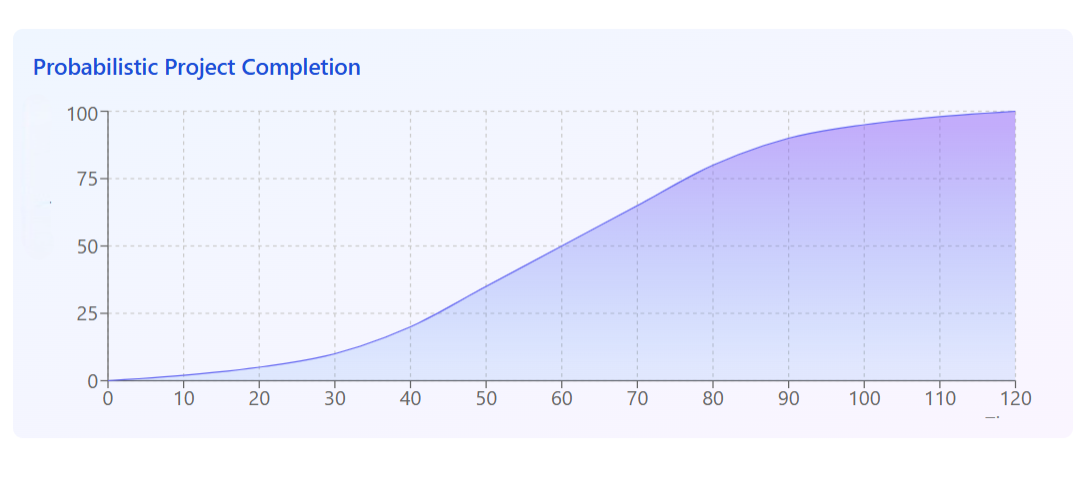
- Analyze the results: After all those simulations, you get a probability distribution showing the likelihood of different completion dates.
What might occur:
- 5% chance of finishing in 40 days
- 50% chance of finishing in 52 days
- 80% chance of finishing in 58 days
- 95% chance of finishing in 65 days
This is incredibly powerful information. You can now say with confidence: "I'm 80% sure we'll finish by day 58."
Key benefits:
- Identifies which tasks are most likely to cause delays
- Shows you where to focus your risk management efforts
- Provides data-driven confidence levels
- Helps determine realistic contingency buffers
Professional tools:
- @Risk (works with Microsoft Project)
- Crystal Ball (integrates with Excel)
- Primavera Risk Analysis
- Oracle Primavera P6
When to use Monte Carlo:
- Larger, complex projects with significant budgets
- Difficult projects with multiple dependencies and uncertainties
- When vendors need high confidence in timelines
- When you have access to simulation software
Graphical evaluation and review technique (GERT)
GERT takes things even further by allowing for conditional logic and loops.
Unlike PERT, which assumes a linear path through your project, GERT recognizes that sometimes you need to:
- Branch in different directions based on performance outcomes
- Loop back and repeat tasks if the results aren't satisfactory
- Follow conditional paths that only activate under certain circumstances
Real-world example:
Imagine you're developing a new product prototype:
- Design phase (always happens)
- Build prototype (always happens)
- Test prototype (always happens)
- If tests pass → Move to production
- If tests fail → Loop back to redesign (70% probability) OR Cancel project (30% probability)
GERT can model these probabilistic branches and loops, making it ideal for:
- Research and development projects
- Quality control processes
- Projects where experimental results determine next steps
- Situations with significant decision points
The downside?
GERT is complex. It requires more effort and skills to set up and maintain. Most project managers stick with PERT or Monte Carlo for practical purposes.
The math behind the calculated estimates

Don't worry, you don't need to be a statistician to use these techniques. But, understanding the basics is valuable.
Beta distribution (PERT formula)
The PERT formula uses what's called a beta distribution. The "4M" in the formula (O + 4M + P) ÷ 6 gives extra weight to the most likely estimate.
Why? Because statistically, the middle scenario is more probable than the extremes.
Triangular distribution
The triangular distribution is simpler. It treats all three estimates equally:
Expected Duration = (O + M + P) ÷ 3
This works well when you don't have much historical data. It's easier to apply, but potentially less accurate.
Understanding confidence levels
Remember that standard deviation calculation? Here's what it tells you:
Most project managers use the 95% confidence level for reporting. It provides reasonable assurance without being overly conservative.
Example:
If your expected duration is 50 days with a standard deviation of 5 days:
- 68% confident you'll finish between 45 and 55 days
- 95% confident you'll finish between 40 and 60 days
- 99.7% confident you'll finish between 35 and 65 days
When should you use probabilistic scheduling?
Not every project needs this level of sophistication. Here's a quick guide:
Use probabilistic scheduling when:
- High uncertainty exists: New technology, unfamiliar domains, or innovative projects
- Stakes are high: Large budgets, critical deadlines, or high visibility
- Risk management is crucial: One delay could cascade through multiple activities
- Complexity is inherent: Multiple dependencies and parallel work streams
Stick with deterministic scheduling when:
- Projects are routine: You've done this many times before
- Work is well-understood: Predictable outcomes based on experience
- Resources are limited: You don't have time for detailed analysis
- Projects are simple: Few tasks, straightforward dependencies, minimal uncertainty
The benefits of probabilistic scheduling in management
Why go through all this effort? Because the payoff is beneficial. Here are the key advantages that make probabilistic scheduling completely worth your time.
Realistic planning activity
Probabilistic scheduling gives a realistic view of the project plan, helping project managers predict uncertainty and its effect on the plan.
Rather than presenting a complete optimistic timeline that sets unrealistic expectations, probabilistic schedules show what's truly achievable given known uncertainties.
Better risk identification
Probabilistic time periods can help identify risks early in the project and provide more accurate estimates of project duration.
When running Monte Carlo simulations, tasks that frequently cause delays become obvious, allowing teams to focus mitigation efforts where they'll have the greatest impact.
Quantified confidence levels and resources
Instead of saying "the project will finish on June 15," probabilistic scheduling enables statements like "there's an 80% probability the project will finish by June 15, and a 95% probability it will finish by June 30."
This quantification helps stakeholders stay informed about commitments and resource allocation factors.
Informed contingency planning
Understanding the probability distribution of project outcomes supports rational decisions about schedule reserves and contingency planning. Rather than arbitrary padding, reserves can be sized based on statistical analysis of likely delays.
Enhanced stakeholder communication

Accurate scheduling is important for managing priorities from different stakeholders, allowing delivery milestones to be set with a certain degree of certainty while substantiating necessary time buffers.
The best practices for probabilistic scheduling success
Ready to implement probabilistic scheduling? These proven strategies will help you get the most value from your efforts.
- Start with good data: Talk to experienced team members. Review historical projects. Get input from subject-matter experts. Your estimates are only as good as your information.
- Match the technique to the project: Simple project? Use PERT. Complex initiative? Go with Monte Carlo. Don't use a sledgehammer to crack a nut.
- Focus on what matters: You don't need probabilistic analysis for every single task. Concentrate on activities that significantly impact the schedule or carry substantial uncertainty.
- Validate your predictions: Compare your probabilistic forecasts against actual outcomes. Did you finish when you predicted? Use this feedback to improve your estimation process.
- Use both approaches: Deterministic scheduling gives you hard deadlines for day-to-day management. Probabilistic scheduling provides insight into risks. Use them together.
- Communicate visually: Show stakeholders S-curves and probability charts. Visuals work better than tables of numbers.
- Update regularly: As your project progresses, update your models. Early estimates will be wide-ranging. Later estimates should narrow as uncertainty resolves.
The future of probabilistic scheduling
Good news: this is getting easier and more common.
Modern project management is building probabilistic features directly into familiar interfaces. You don't need to be a statistics expert anymore.
Artificial intelligence is also stepping in. Machine learning algorithms can analyze historical project data to suggest more accurate probability distributions. They spot patterns that humans might miss.
Organizations that embrace these techniques gain real competitive advantages:
- Better risk management
- More reliable commitments
- Improved stakeholder confidence
- Fewer nasty surprises
Master scheduling for the real world, not the ideal one
Probabilistic scheduling requires more effort than traditional scheduling. But, for complex or uncertain smaller projects, that effort pays off many times over.
The choice isn't really between deterministic and probabilistic scheduling. Rather, it requires expert judgment to decide when to use each approach.
The future belongs to project managers who can account for uncertainty with confidence. Probabilistic scheduling allows you to do exactly that.
_light%201.png)